



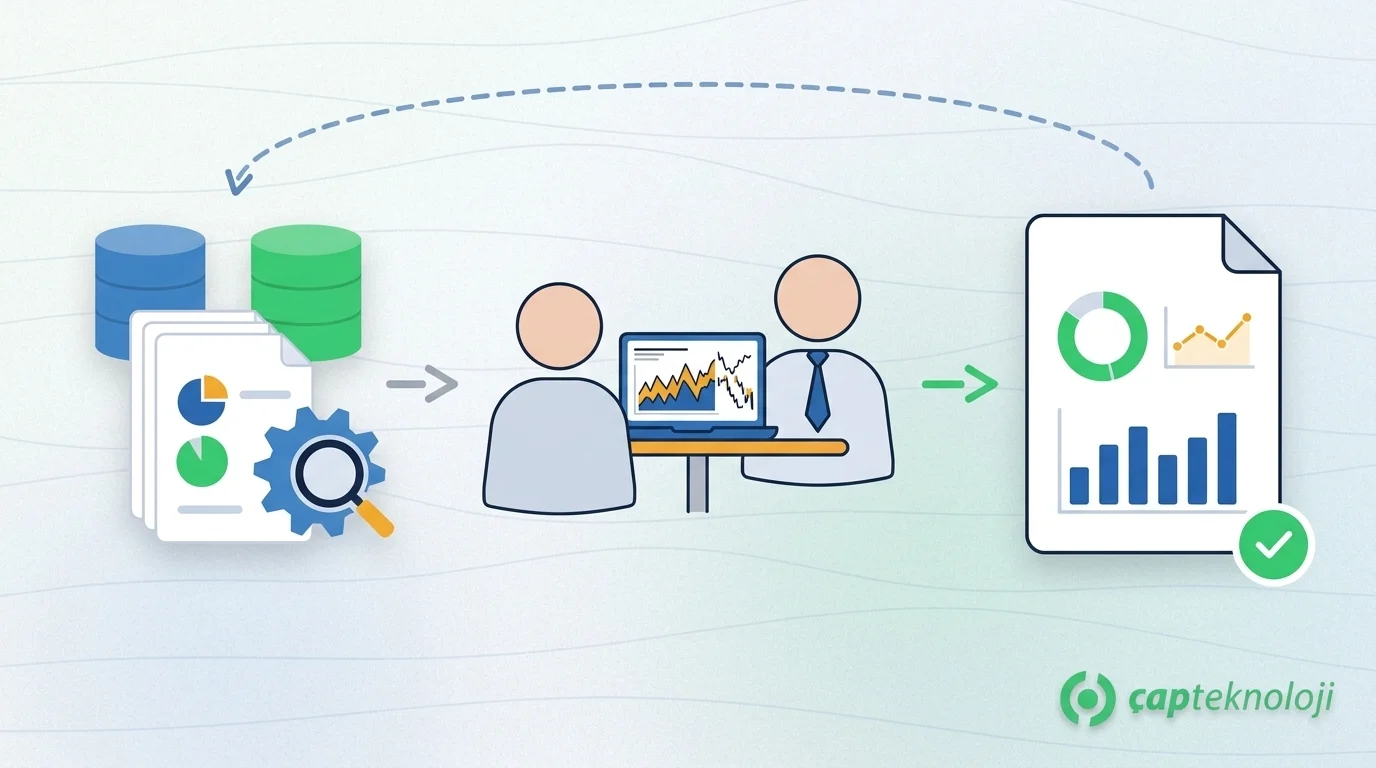
In short: Reporting consulting is the service of turning the scattered reports a business prepares by hand into reports that are based on a single data source, share the same definitions and refresh automatically. The aim is not to produce more reports, but to let everyone make decisions by looking at the same number.
In many businesses, reporting means a few people pulling data from different systems at the end of the month and combining it in Excel. By the time the report is ready the data is out of date, and two departments often present different figures for the same indicator. This article explains what reporting consulting is, when it is needed, the steps of the process and the mistakes made most often.
What Is Reporting Consulting?
Reporting consulting is the work of determining what information a business needs, how often and for whom, and then setting up a reporting structure that produces this information reliably. Its scope is not limited to report design. Reviewing data sources, defining indicators, refreshing reports automatically and training users are also part of the process.
This work is often the first step of a broader business intelligence consulting project. Moving on to advanced analysis or forecasting before regular, reliable reports are in place is like building on unstable ground.
When Is Reporting Consulting Needed?
If several of the following situations sound familiar, it may be time to review your reporting structure:
- Different departments present different figures for the same indicator.
- Preparing month-end reports takes days.
- Reports depend on the knowledge and files of a single person.
- Managers have to request a report and wait in order to see the current situation.
- Excel files slow down as they grow, and formula errors go unnoticed.
- The ERP system holds the data, but not in a form that can be used for decisions.
Differences Between Manual and Automated Reporting
| Criterion | Manual reporting | Automated reporting |
|---|---|---|
| Data source | Copied from different files | Taken directly from the systems |
| Timeliness | Shows the situation at the time of preparation | Refreshes by itself at the set interval |
| Risk of error | Open to copying and formula errors | Rules are defined once and applied the same way every time |
| Definitions | May vary with the person preparing it | Shared across all reports |
| Dependence on individuals | No report when the preparer is away | The process runs independently of individuals |
| Time spent | Most of the time goes to collecting data | Time is spent interpreting data |
The Reporting Consulting Process: 5 Steps
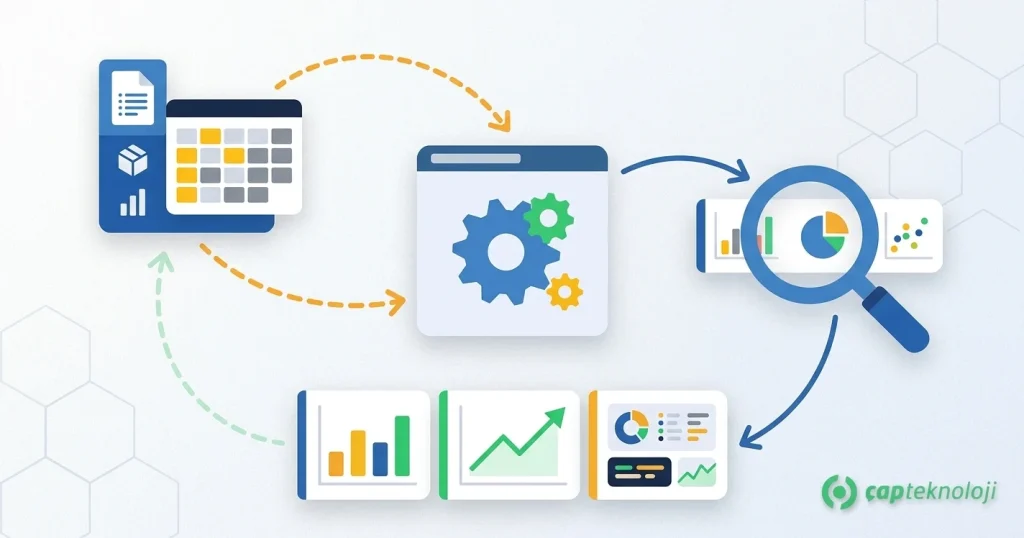
1. Needs analysis and report inventory
In the first step, a list of existing reports is drawn up. It is determined who uses which report, how often and for which decision. This work usually reveals both the reports nobody reads and the information that is missing.
2. Reviewing data sources
The systems that feed the reports are reviewed: ERP, accounting, sales, production and manually kept files. Where the data is produced, how reliable it is and how it matches across systems becomes clear at this stage.
3. Creating definitions and the data model
The definitions of indicators such as revenue, active customers or stock turnover are put in writing. A shared data model that applies these definitions is then built. When deciding which indicators to monitor, you can refer to our article on which KPIs to track in ERP.
4. Designing reports and automatic refresh
Reports are designed according to the role of the person who will use them. A manager wants a summary, while an operations lead wants to drill into detail. Data refresh is scheduled, and reports are updated without manual intervention. For a practical example, see our article on setting up a Power BI dashboard.
5. Go-live, training and ownership
New reports are used alongside the old ones for a while and the figures are compared. Users are shown how to read the reports. An owner is assigned for each report; a report without an owner goes out of date over time.
The Difference Between Reporting and Business Intelligence
The two concepts are close, but they are not the same. Reporting shows what happened in a regular and reliable way: how much was sold this month, what is in stock, which receivable is overdue. Business intelligence adds analysis that investigates why it happened and what may happen next. Sound business intelligence work is built on reliable reporting.
Common Mistakes in Reporting Projects
- Starting with the tool: Choosing software before deciding which questions need answering moves the existing confusion onto a new screen.
- Trying to report everything: A screen with dozens of indicators does not make decisions easier.
- Not writing down definitions: If an indicator has no written definition, the same discussion is repeated at every meeting.
- Skipping data quality: Incorrect data at the source looks incorrect in even the best designed report.
- Not assigning ownership: If it is unclear who is responsible for the accuracy of a report, errors accumulate.
- Not retiring old reports: As long as old and new reports coexist, different figures keep circulating.
Reporting Consulting Checklist
- Has a list of existing reports and their purpose been drawn up?
- Is there a written definition for each indicator?
- Are the data sources and their update frequencies known?
- Are reports separated by role?
- Is data refresh automatic, and is there a notification when it fails?
- Does each report have an owner?
- Were the old reports retired once the new ones went live?
If you would like to review your reporting structure together, you can look at our business intelligence (BI) consulting service or get in touch with us.
Frequently Asked Questions
What is reporting consulting?
Reporting consulting is the service of turning the scattered reports a business prepares by hand into reports that are based on a single data source, share the same definitions and refresh automatically. It covers needs analysis, review of data sources, report design and user training.
Are reporting consulting and business intelligence consulting the same thing?
No. Reporting shows what happened in a regular and reliable way. Business intelligence adds analysis that investigates why it happened and what may happen next. Reporting is usually the first step of business intelligence work.
Can we keep reporting with Excel?
Excel can be sufficient for small data volumes and a small number of reports. When reports multiply, data comes from more than one system or different figures start circulating for the same indicator, moving to automated reporting is the sounder choice.
How long does a reporting project take?
The duration depends on the number of reports, the number of data sources and the quality of the data. Work that starts with the basic reports of a single department takes far less time than a project covering the whole company. Starting with a small scope and extending it step by step is recommended.
Do we need to replace our ERP system for reporting?
Usually not. Reporting work uses the data in the existing ERP and other systems. The first step is to check whether the available data is correct and consistent; a system change only comes up if the current system cannot meet the need.