



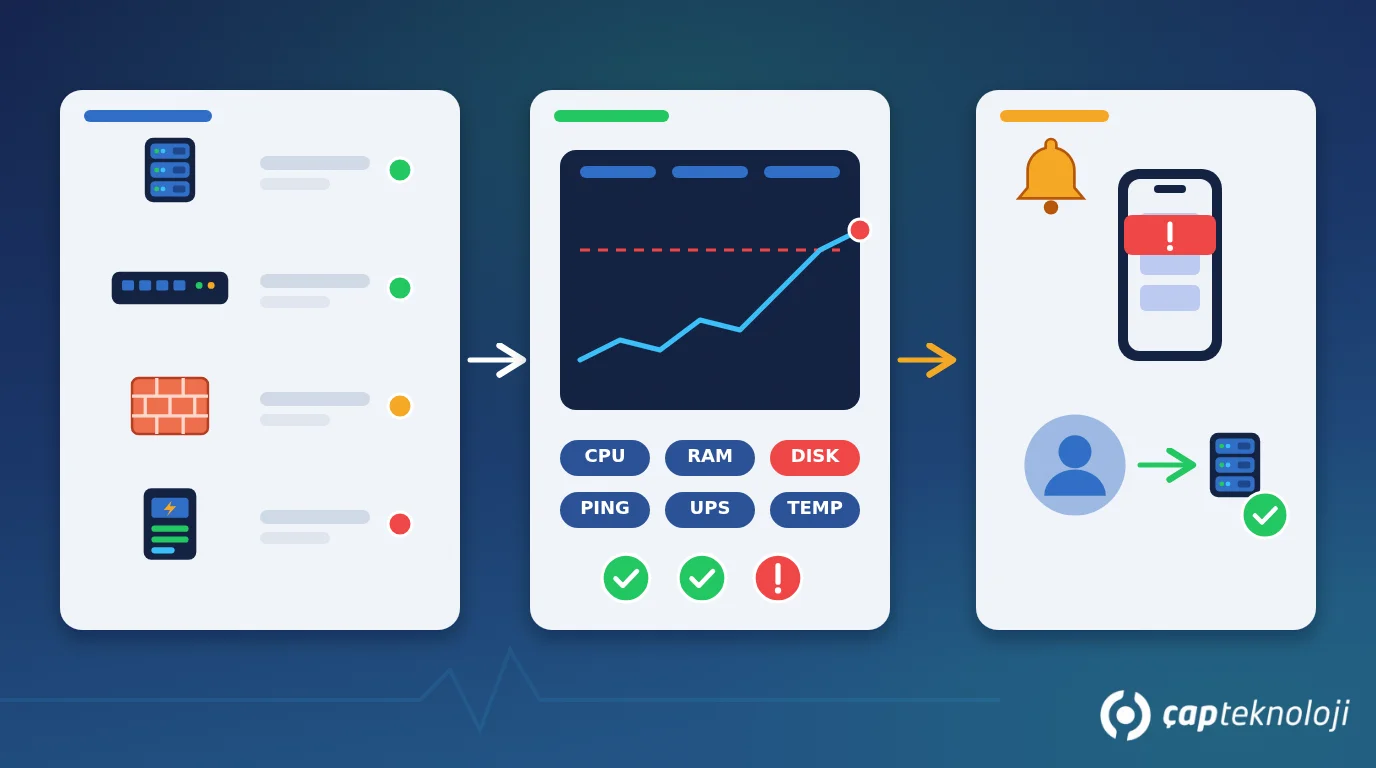
In short: Server and network monitoring means continuously measuring the health of servers, network devices, internet lines and critical services, and alerting the right person before a problem grows. In many SMEs, outages are noticed only when a user says “the system won’t open”. With well-chosen metrics, two-level thresholds and a simple on-call rule for who receives alerts, most problems can be caught before users are affected.
A Monday morning in a small business can start like this: the ERP won’t open, shared folders are unreachable and e-invoices cannot be sent. When someone finally logs on to the server, it turns out the disk filled up over the weekend, the nightly backup has been failing for three days, or the UPS battery has long been weak. None of this happened suddenly; each problem gave measurable signs days in advance. The issue is that nobody was looking. This article explains what to monitor, how to set thresholds and how to build a monitoring routine step by step.
Contents
- What is server and network monitoring?
- What should be monitored?
- A 6-step monitoring setup
- Security, data protection and false alarms
- Summary and checklist
- Frequently asked questions
What is server and network monitoring?
Monitoring means checking IT infrastructure components at regular intervals, recording the measured values and raising an alert when predefined limits are exceeded. It answers four basic questions:
- Availability: Is the server, service or device running and responding right now?
- Performance: How much load are the CPU, memory, disk and network under?
- Capacity: At the current rate, when will disk space, licences or bandwidth run out?
- Events: Did a backup fail, did a service stop, is there an unusual sign-in attempt?
Monitoring tools collect this data in different ways. A small piece of software installed on a server (an agent) sends detailed data. Devices that cannot run an agent, such as switches, firewalls, printers and UPS units, are usually queried via SNMP, a standard network management protocol. Websites and external services are checked from outside with simple availability tests (ping, HTTP requests). Monitoring does not replace an IT infrastructure audit: an audit takes a snapshot at one point in time, monitoring takes the pulse every day.
What should an SME monitor?
Trying to monitor everything often ends with nobody looking at anything. For a start, the following components are enough for most businesses:
| Component | What to monitor | Example alert |
|---|---|---|
| Servers (physical and virtual) | Availability, CPU, memory, disk usage, critical services | Database server disk is almost full |
| Application services | SQL Server, ERP services (e.g. Logo), e-mail, file shares | SQL Server service stopped |
| Backups | Time and result of the last successful backup | Nightly backup has failed for two days |
| Network devices | Switch and firewall reachability, port status, bandwidth | Core switch unreachable |
| Internet line | Reachability, latency, packet loss; failover if there is a backup line | Primary line down, switched to backup |
| Physical environment | UPS battery health, mains failure, server room temperature | UPS running on battery |
| Expiring items | SSL certificates, domains, licences and warranty end dates | Certificate expires in 14 days |
The backup and expiry rows are the ones most often skipped, yet they cause the most expensive surprises. Knowing that backups actually run is the first requirement of any disaster recovery plan.
How to set up server and network monitoring in 6 steps
1. Build an inventory
List every server, virtual machine, network device, line and service. For each one, note how critical it is: does an outage affect the whole company or a single department? Without an inventory, monitoring will always have gaps.
2. Choose the critical metrics and services
Pick two or three meaningful measurements per component. Disk usage and the SQL service on the database server, reachability and packet loss on the internet line, and battery status on the UPS are usually a good start. A few of the right metrics are worth more than dozens of charts nobody reads.
3. Choose a monitoring tool
Options include open-source tools such as Zabbix, commercial products such as PRTG and cloud-based monitoring services. The deciding factors are the number of devices, agent and SNMP support, notification channels, reporting needs and who will maintain the tool. Keep the monitoring server separate from the systems it watches; when the main server goes down, the tool that sends the alert must not go silent with it.
4. Define two-level thresholds
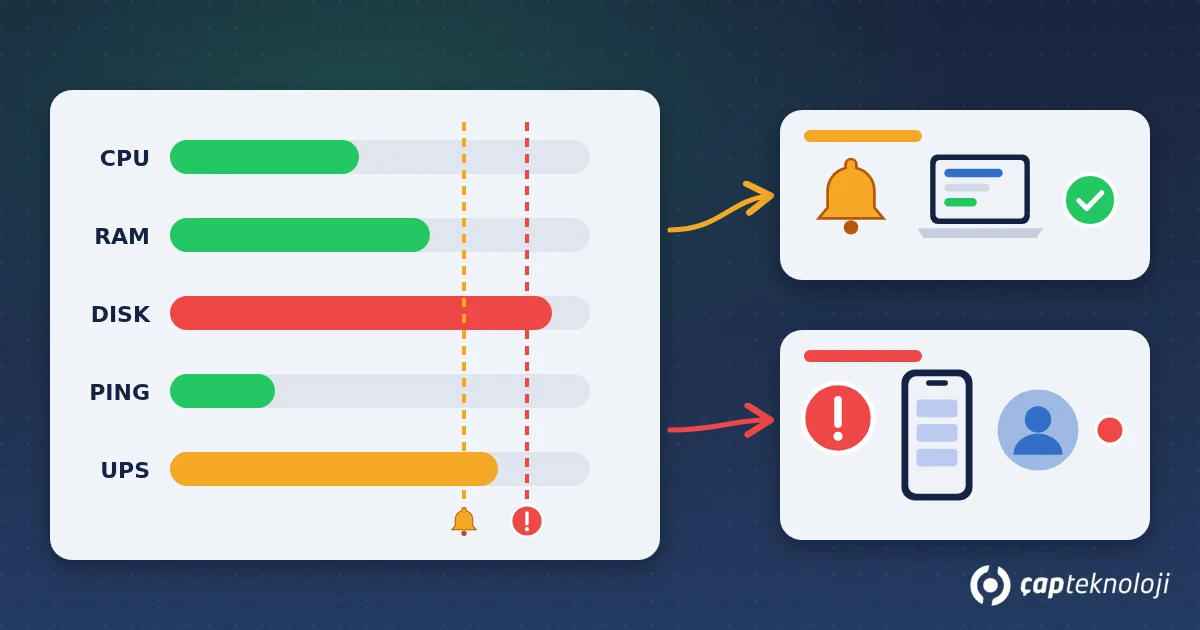
Set a “warning” and a “critical” threshold for each metric. A warning is information to review during working hours; a critical alert needs immediate action. To avoid alarms on short spikes, require the value to stay above the threshold for a certain time. For slowly filling resources such as disks, a forecast based on the growth rate can be used alongside the usage level.
5. Decide who gets alerts and how
Alerts that land in a shared mailbox get lost. Send warnings to e-mail or a team chat channel, and critical alerts as push notifications or SMS to the on-call person’s phone. Define a simple escalation order so the alert moves to the next person if nobody responds within a set time.
6. Review regularly
Once a month, look at which alerts came in, which ones were noise and whether any outage was missed. Adjust thresholds accordingly and add new devices to monitoring. Capacity charts are also a good basis for planning disk or hardware investments in advance.
Security, data protection and false alarm risks
Because the monitoring system sees the entire infrastructure, it is an asset that needs protection itself:
- Permissions: Give the accounts used by the monitoring tool read-only rights. Avoid monitoring with an administrator account.
- Protocol security: If you use SNMP, prefer SNMPv3, which provides encryption and authentication, and change default community strings such as “public”.
- Access: Restrict access to the monitoring dashboard and use multi-factor authentication. The dashboard should not be exposed to the internet.
- Data protection (KVKK/GDPR): Event logs may contain personal data such as user names, IP addresses and session details. In Turkey this falls under KVKK, the Turkish personal data protection law, and in the EU under the GDPR. Define retention periods and limit access by role. If you use a cloud monitoring service, review where the data is stored and any cross-border transfer with your legal adviser.
- Alert fatigue: A system that constantly raises unnecessary alarms is soon ignored, and the real outage slips through. Tuning thresholds regularly is therefore a security measure in itself.
Summary and checklist
- The inventory of servers, network devices, lines and services is current, with criticality levels.
- Two or three meaningful metrics are chosen per component; backups and expiry dates are included.
- The monitoring tool runs separately from the systems it monitors.
- Warning and critical thresholds are defined for each metric.
- Critical alerts reach the on-call person’s phone, with escalation if nobody responds.
- Monitoring accounts are read-only, the dashboard is protected with MFA and log retention is defined.
- Alerts and thresholds are reviewed monthly.
Setting up monitoring is not technically hard; the hard part is choosing the right metrics and keeping the system alive. As part of ÇAP Teknoloji’s server and network consulting, we can inventory your infrastructure with you and set up the monitoring tool and thresholds to match what your business really needs.
Frequently asked questions
Does a small business really need monitoring?
Even with a single server and a few network devices, disk usage, backup results, the UPS and the internet line are worth monitoring. The setup takes a few hours, and preventing a single day of downtime easily pays for it.
Are free tools good enough?
Open-source tools have the capabilities most SMEs need. The deciding factor is not the tool but who maintains it after setup. If nobody owns that responsibility, a paid tool will not help either.
Should cloud servers and services like Microsoft 365 be monitored too?
Yes. The cloud provider monitoring its own infrastructure does not cover the disk on your virtual server filling up or your application stopping. External availability tests and service health notifications close that gap.
Does monitoring prevent outages?
Monitoring does not eliminate failures; it shortens the time to notice them. For predictable problems such as a filling disk or an expiring certificate, early warning lets you act before any outage happens.