



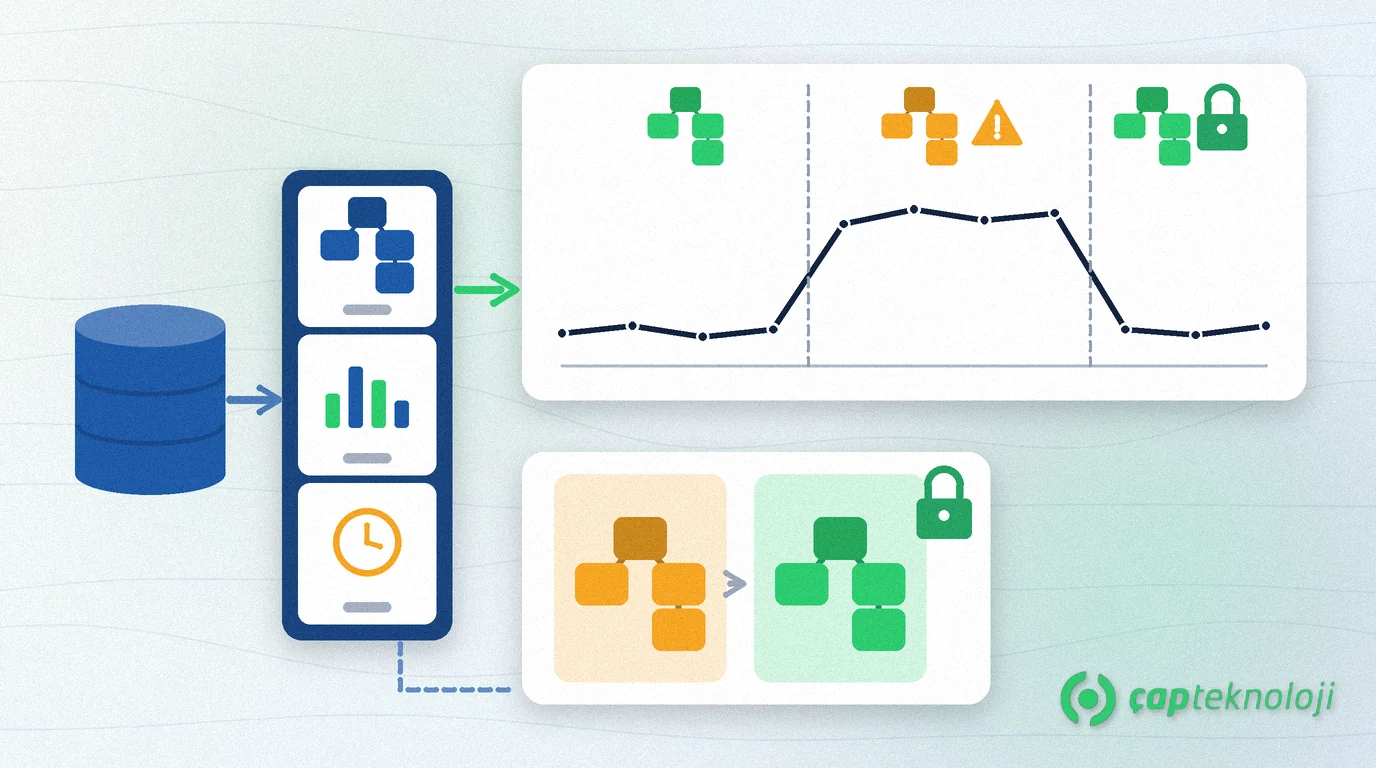
In short: SQL Server Query Store is a built-in feature that records the plans and runtime statistics of the queries in a database over time. If a report that ran fast yesterday is slow today, Query Store shows you which query slowed down, when, and after which plan change, and lets you force the earlier, faster plan without changing application code.
A complaint we often hear in SMEs: “The system suddenly got slow, but nobody changed anything.” Often nobody did change any code; SQL Server picked a new execution plan for the same query because statistics were updated or the data distribution shifted. The trouble is that without a record of the previous plan, finding the cause turns into guesswork. Query Store keeps that record for you.
Contents
- What is Query Store?
- How it differs from the plan cache
- Using it in 6 steps
- When is plan forcing right?
- Common mistakes
- Summary and checklist
What is SQL Server Query Store and what does it record?
Query Store is a monitoring feature in SQL Server 2016 and later, enabled per database, that stores query texts, execution plans and their statistics such as duration, CPU and reads, split into time intervals.
According to Microsoft’s Query Store documentation, the data lives in three stores:
- Plan store: the execution plans used for each query.
- Runtime stats store: duration, CPU, logical reads, memory and similar metrics, aggregated over fixed time windows.
- Wait stats store: what the query waited on (locks, disk, CPU, memory). This dimension arrived with SQL Server 2017.
One important detail: Query Store is off by default in SQL Server 2016, 2017 and 2019. Starting with SQL Server 2022 it is on by default for newly created databases. Do not assume it is on for databases moved from an older version or restored from a backup; check.
Why is Query Store more useful than the plan cache?
SQL Server already keeps plans in the in-memory plan cache. But the plan cache stores only the latest plan per query and evicts plans under memory pressure. That is not enough to investigate a slowdown after the fact.
| Feature | Plan cache | Query Store |
|---|---|---|
| Plans kept | Latest plan only | Several plans per query, with history |
| Persistence | In memory; lost under memory pressure and on restart | Stored inside the database |
| Time dimension | None, a snapshot | Statistics per time interval |
| Fix option | None | Force an earlier plan (plan forcing) |
| Wait information | Server-wide | Per query (SQL Server 2017 and later) |
How to use SQL Server Query Store in 6 steps
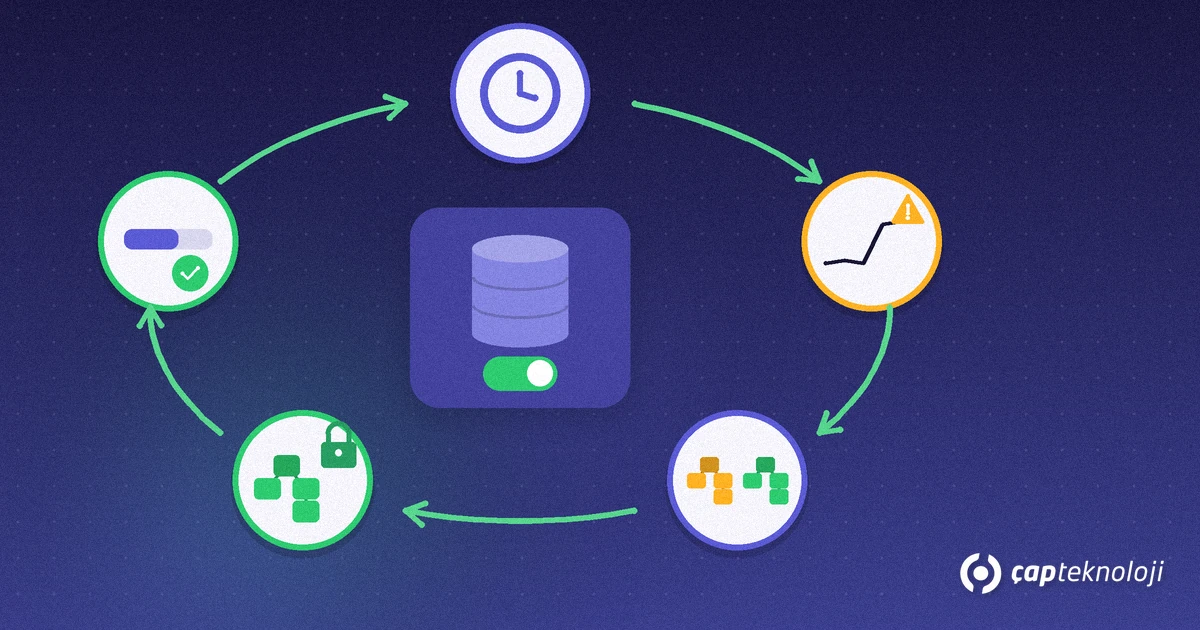
1. Check the version and current state
Query the sys.database_query_store_options view in the database. If actual_state_desc differs from desired_state_desc, Query Store has switched mode on its own; the most common case is a fall into read-only mode because its space ran out. Query Store cannot be enabled for master or tempdb; your focus is the ERP and application databases.
2. Turn it on and tune the settings to your workload
Use the Query Store page in the database properties in SQL Server Management Studio or this statement: ALTER DATABASE [YourDatabase] SET QUERY_STORE = ON (OPERATION_MODE = READ_WRITE); Then set the capture mode to AUTO, keep size-based cleanup on and decide how long old data is kept. Make the change outside business hours and check free disk space on the server first.
3. Let data build up
Query Store records from the moment it is switched on; it does not bring back history. To compare, wait for data that covers at least one normal business day, including busy periods such as month-end reporting. Having it on before a slowdown means you have the “before” data when the incident happens.
4. Find regressed and top resource-consuming queries
In Management Studio, open the Query Store folder under the database and use Regressed Queries, Top Resource Consuming Queries and Query Wait Statistics. Pick duration, CPU or logical reads as the metric and focus on the time window when the slowdown began. If the wait category is mostly locks, the problem is blocking rather than the plan; see our article on SQL locking.
5. Compare the plans and understand the root cause
Open two plans of the same query side by side. If the new plan switched from an index seek to a table scan, shows a large gap between estimated and actual row counts or carries a missing index warning, you have most likely found the cause. For statistics and fragmentation, our SQL Server index maintenance guide helps.
6. Force the good plan if needed and monitor the result
If the earlier plan is clearly faster, select it in Regressed Queries and choose Force Plan, or use the sp_query_store_force_plan procedure. Then watch the query’s duration for a few days and review forced plans regularly: after changes such as a schema change, forcing can fail and SQL Server falls back to normal compilation.
When is plan forcing the right fix, and when is it not?
- Right: the query, data and schema are the same, but SQL Server picked a new, clearly slower plan. Forcing quickly relieves users while you prepare a lasting fix.
- Not enough: a missing index, stale statistics or a badly written query. Forcing only hides the symptom. Fix the root cause, then remove the forcing.
- Risky: data distribution varies widely by customer or branch, so one plan may be good for some parameters and bad for others. Test with different parameters before forcing.
Query Store is especially valuable for packaged ERP software such as Logo, where you cannot change the query text. For general slowness, start with our Logo database slow checklist.
Common mistakes with Query Store
- Turning it on only when trouble starts: without history there is no “before” to compare with.
- Missing the switch to read-only: when the space is full, recording stops; monitor the state regularly.
- Forgetting forced plans: months later, after schema or data changes, the old plan can become the next problem.
- Dropping and re-creating procedures: DROP and CREATE breaks the query’s history; use ALTER where possible.
- Not comparing after a version upgrade: compare plans before and after the upgrade with Query Store; see our SQL Server upgrade guide for the steps.
Summary and Query Store checklist
- Is Query Store on and in read-write mode for critical databases?
- Is the capture mode AUTO and is automatic cleanup on?
- Are the actual and desired states checked regularly?
- Is Regressed Queries the first place you look when users report slowness?
- Is there a written list of forced plans and why they were forced?
- Is forcing removed once the root cause is fixed?
Put simply, SQL Server Query Store turns “why did it get slow?” from a guess into evidence. At ÇAP Teknoloji we can enable Query Store with the right settings on your databases, analyse slow queries with you and implement lasting fixes as part of our SQL consulting; reach us via our contact page.
Frequently Asked Questions
Which SQL Server versions include Query Store?
Query Store is available in SQL Server 2016 and later. It is off by default in SQL Server 2016, 2017 and 2019; starting with SQL Server 2022 it is on by default for newly created databases. Check existing databases with the sys.database_query_store_options view.
Does Query Store slow the server down?
Because it records continuously, Query Store adds some overhead and uses disk space. Keep that under control by setting the capture mode to AUTO, leaving size-based cleanup on and installing current cumulative updates. Make the change at a quiet time first and watch the server.
Is plan forcing a permanent fix?
Usually not. Plan forcing quickly relieves users when SQL Server has picked a new, slower plan. Root causes such as a missing index or stale statistics still need fixing, and forced plans should be reviewed regularly.
Why does Query Store switch to read-only?
The most common reason is that the space allocated to Query Store is full, so new data is no longer recorded. Increase the maximum size or clean up old data, then set it back to read-write. Checking the actual and desired state regularly catches this early.