



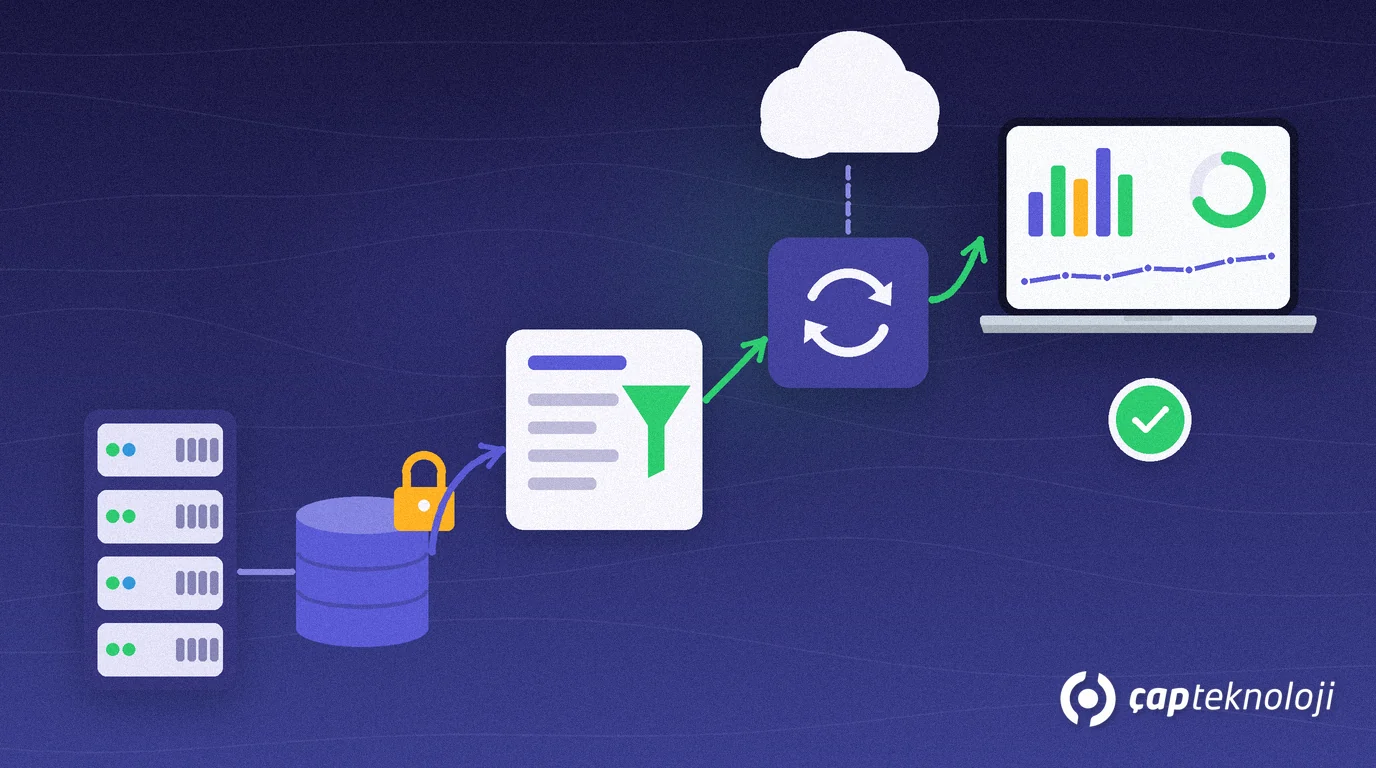
In short: To build Power BI reports from Logo data, you connect Power BI to Logo’s SQL Server database through a read-only login and prepared reporting views. You import the data, build a simple model with invoice lines at its centre, and design the first dashboard around a few clear questions. For automatic refresh you install a data gateway on a server inside the company.
As a Logo partner, the request we hear most often in projects is: “We want an up-to-date sales report every morning without exporting to Excel.” This article walks through connection, model and first dashboard for companies using Logo Edge T-Series (formerly Logo Tiger 3) and Logo Edge N-Series (formerly Logo Netsis 3). We covered general modelling rules in our article on the Power BI star schema; here we focus on the Logo side.
Contents
- What is a Power BI report from Logo data?
- Before you connect: a read-only login and reporting views
- Connecting with Power BI Desktop: Import or DirectQuery?
- The data model: invoice lines in the centre, master data around them
- Building your first dashboard in 5 steps
- Refresh and sharing: the data gateway
- Checklist
- Summary
What is a Power BI report from Logo data?
A Power BI report from Logo data takes sales, stock, customer and finance records from the Logo ERP SQL Server database into Power BI and turns them into dashboards that refresh automatically. It does not replace the lists inside Logo; it brings the handful of figures management checks every day into one place.
Logo Edge T-Series and Logo Edge N-Series store their data in Microsoft SQL Server. In T-Series, table names contain the firm number, and movement tables also contain the period number (names starting with LG_). N-Series uses a different table structure. So the first job is to map which information sits in which table, together with someone who knows Logo.
Before you connect: a read-only login and reporting views
Do two things before you connect Power BI to the Logo database. Both decide how secure the report is and how long it keeps working.
- Read-only login: Create a separate SQL Server login for reporting and give it read permission only. Do not use an administrator account or the account the Logo application uses.
- Reporting views: Instead of loading raw tables one by one, prepare views that select only the columns you need. Keeping these views in a separate reporting database rather than in the Logo database makes version upgrades easier.
- Personal data: If the report does not really need phone numbers or addresses from customer cards, leave them out of the view. Under data protection rules, the safest field is the one you never copy.
If the database is already slow, fix that first. Report queries put extra load on a slow server; we collected what to check in our article on a slow Logo database.
Connecting with Power BI Desktop: Import or DirectQuery?
In Power BI Desktop you choose the SQL Server connector, enter the server and database name and select your views. The real decision here is whether the data is copied into the model.
| Import | DirectQuery | |
|---|---|---|
| Where does the data live? | Copied into the Power BI model | Stays in the Logo database; every interaction sends a query |
| Dashboard speed | Usually fast | Depends on the source server |
| Load on the Logo server | Only during refresh | Whenever users work with the dashboard |
| When does it fit? | First dashboard and daily management reports | When near real-time data is a must and the server can handle it |
For a first project we recommend Import. It does not slow the Logo server during the day, and dashboards open quickly. Microsoft’s DirectQuery documentation explains the difference between the two modes in detail.
The data model: invoice lines in the centre, master data around them
For a sales report the central table is the invoice lines: each row has a date, item, customer, quantity and amount. Around it sit item cards, customer cards, sales reps, warehouse or branch, and a date table. This is a star schema, and it is the model that works most smoothly in Power BI.
Points to watch with Logo data:
- Filter out cancelled documents and non-invoice slip types in the view.
- Decide up front whether returns show as negative amounts.
- Do not mix local currency and reporting currency fields; write down which one the dashboard shows.
- If several firms or periods are reported, add firm and period as columns and combine the tables in one view.
Building your first dashboard in 5 steps
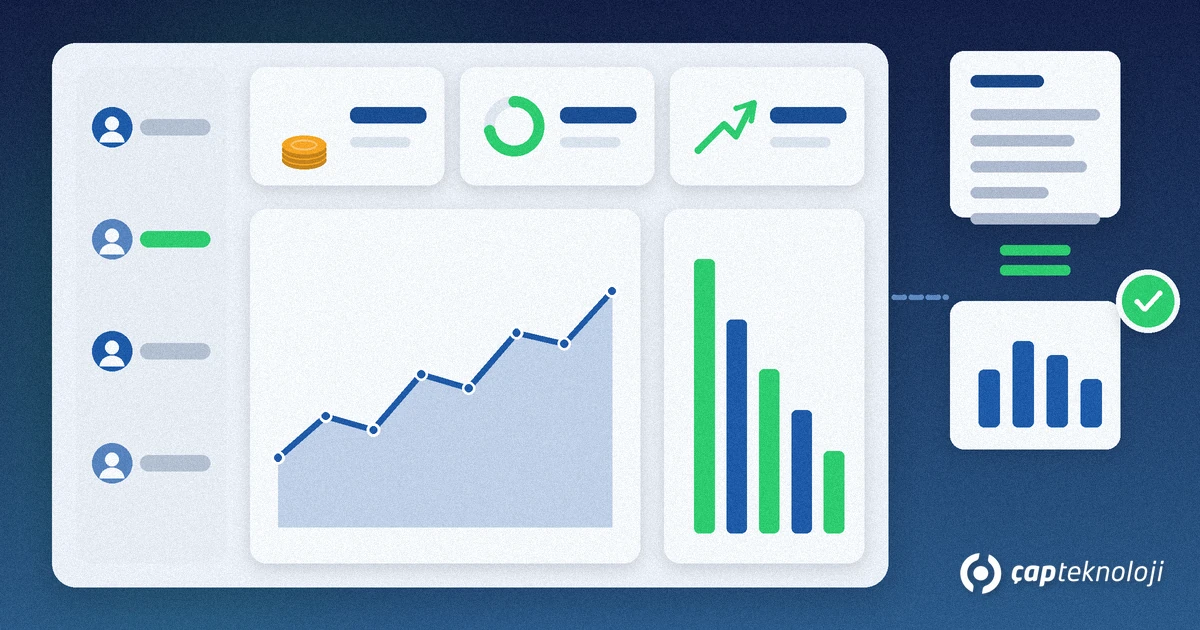
- Write down the questions: Define 3 to 5 questions the dashboard must answer. For example: What did we sell this month, how does it compare with the same month last year, and who are the top customers and products?
- Define the measures: Create measures such as net sales, returns and quantity once in DAX. If cost data is not reliable, leave profitability out of the first version.
- Choose the visuals: A few KPI cards at the top, a monthly trend in the middle and a top customers or products chart beside it are enough.
- Add filters: Branch, sales rep and product group are the filters most managers ask for first.
- Check the numbers: Compare the totals of a closed month with Logo’s own report. Do not publish a dashboard whose numbers do not match.
For choosing KPIs, see the sales and operations list in our article on a Power BI dashboard for SMEs.
Refresh and sharing: the data gateway
Because the Logo database sits on a server inside the company, the Power BI service cannot reach it directly. To publish the report to the Power BI service and schedule refresh, you need an on-premises data gateway. Microsoft describes the on-premises data gateway as a bridge between on-premises data and its cloud services.
Install the gateway on a server that is always on and can reach SQL Server, not on a laptop. Schedule refresh outside working hours. If not everyone should see every branch, set up role-based limits with Power BI row-level security.
Checklist
- Is there a separate, read-only SQL Server login for reporting?
- Are the needed columns collected in views in a separate reporting database?
- Have unnecessary personal data fields been left out?
- Is the first dashboard built in Import mode?
- Is the model a star with invoice lines and master data tables?
- Are there written rules for cancelled documents, returns and currency fields?
- Do the totals of a closed month match the Logo report?
- Is the gateway installed on a server, with refresh scheduled outside working hours?
- Is it noted that the views must be tested after every Logo upgrade?
Summary
The safe way to build Power BI reports from Logo data is a read-only login, separate reporting views, a simple star model in Import mode and a few KPIs checked against Logo’s own reports. Install the data gateway on a permanent server for automatic refresh and test the views after every Logo upgrade.
At ÇAP Teknoloji we map the Logo tables, build the reporting views and set up the first dashboard together with you. Read more on our BI consulting and ERP consulting pages or contact us.
Frequently Asked Questions
Can Power BI connect directly to the Logo database?
Yes. Logo Edge T-Series and N-Series store their data in SQL Server, so you connect with Power BI’s SQL Server connector. We recommend doing it through a read-only login and prepared views.
Should I choose Import or DirectQuery for a Logo report?
Import is the better fit for a first dashboard. Dashboards open quickly and the Logo server only works during refresh. Consider DirectQuery when near real-time data is a must and the server can take the extra load.
Will report queries slow Logo down?
In Import mode the load is limited to refresh time; schedule refresh outside working hours and users will not notice. With DirectQuery every dashboard interaction sends a query to the Logo database.
What do I need for the Power BI report to update itself every day?
Because the Logo database is on premises, the Power BI service needs an on-premises data gateway to reach it. Install the gateway on an always-on server and set up scheduled refresh.
Will the report break after a Logo upgrade?
Upgrades can change the table structure. That is why you should connect the report to views rather than raw tables and test the views after every upgrade.